Many of you may have observed that a balloon falls. You might also have noticed that it falls slower than other objects. Moreover, if we drop it from a height of 2 metres, it sustains the same damage as if it were dropped from 100 metres (none at all). Thus, the speed of the balloon remains roughly constant. But what causes this phenomenon? Why doesn’t this object accelerate in the same way as others?
To investigate the phenomenon closely, I recorded several balloon drops from a specified distance using a camera. In the video, the distances are proportional to real-life distances, so one only needs to find a scale ratio, and then the balloon’s position can be tracked with centimetre accuracy. I determined this scale ratio by sticking a 20cm tape measure somewhere and observing how many pixels it occupied in the video. A simple division provided the scale ratio.
The video is great for capturing precise movements. However, even in slow motion, it’s hard to determine how the speed changes. Therefore, I wrote a program in Processing (a Java-based visualisation library) that analyses the video frames and can pinpoint the balloon’s location. By comparing two or more frames and positions, it’s easy to determine the instantaneous speed. The program’s source code can be downloaded from: https://github.com/tothambrus11/balloon-image-processing
Here you can see the program in action:
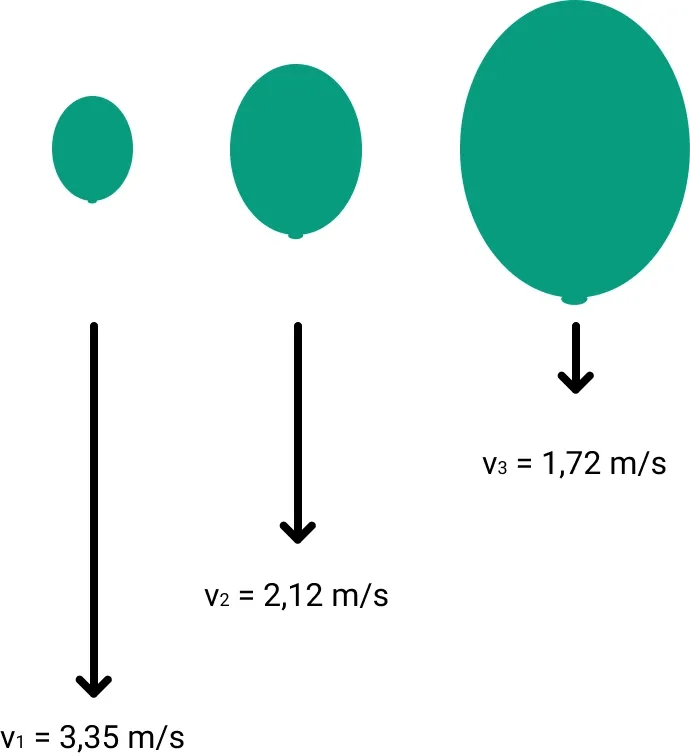
Observations: - Larger balloons fall for longer and have a higher terminal and average speed. - The balloon has an acceleration phase, then moves at roughly a constant speed. - When the balloon drifts or turns, its speed decreases.

The explanation lies in the laws of air resistance. (Actually, these laws were established based on experiments, but let’s verify the experiment now…) An object moving in a liquid or gaseous medium experiences what’s known as the drag force. The magnitude of this force increases quadratically with the object’s speed. So, if I launch a sphere at a low speed, it’s slightly slowed down, but if launched at high speed, it’s resisted with a much larger force. This leads to a point of equilibrium when the gravitational force accelerating the object equals the drag force, resulting in zero acceleration, and the object falls at a constant speed.
There are several factors influencing the magnitude of the drag force, such as the medium’s density, the object’s shape factor (how streamlined it is), and the object’s frontal area. Hence, if we inflate a balloon to a larger size, increasing its frontal area and the resistance, the resulting drag force will also increase.
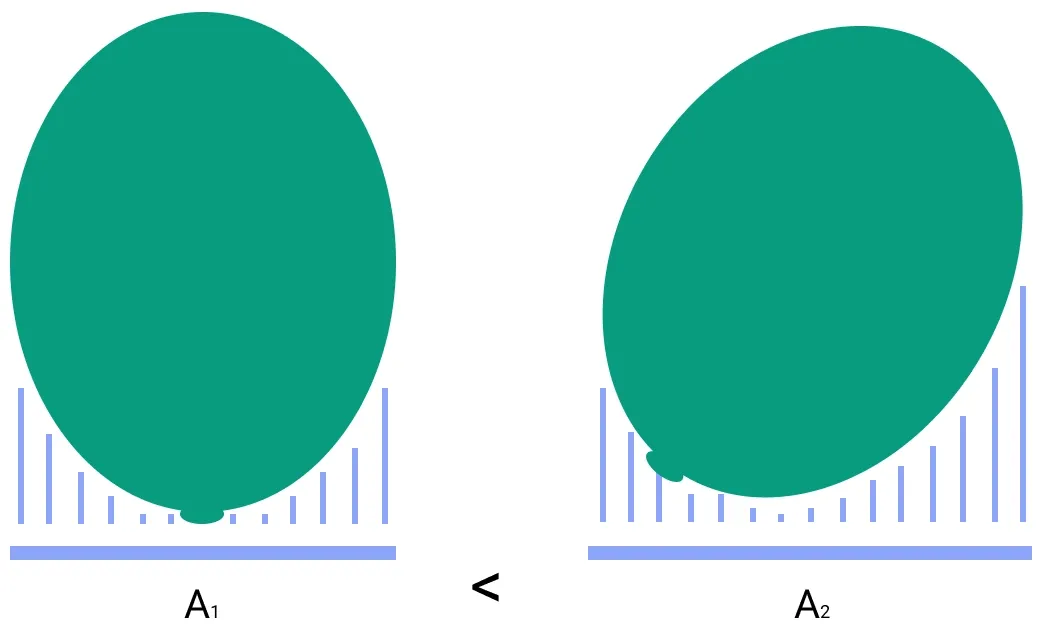
The balloon isn’t perfectly spherical, so it occasionally rotates, altering its shape factor and frontal area. This causes variations in its terminal velocity. A larger frontal area results in a greater drag force, so the balloon falls more slowly during these times.

But what are the practical applications of this camera-based speed measurement method?
Unfortunately, I forgot to measure the weight of the balloon I used. Luckily, using the measured terminal velocities, we can calculate this weight after establishing a motion equation. Since we know that the object doesn’t accelerate in an equilibrium state but moves at a specified speed in a straight line, we can say that the net force on the object, or its sum, is zero.
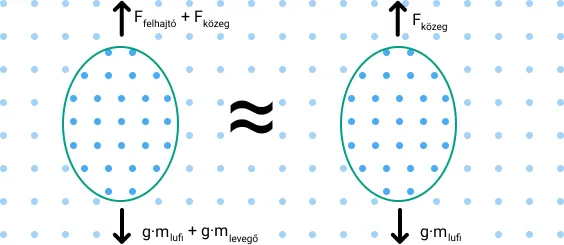
Ignoring the fact that the air inside the balloon is slightly denser than the outside air, which means the buoyant force acting on it would slightly differ from its weight, making our balloon slightly heavier, we can simplify our calculations. This way, we don’t have to consider the density of the air inside the balloon, which is currently unknown.

- where is the drag coefficient (for a sphere, it’s )
- is the density of the air (at 23°C, ρ = 1.193 kg/m3)
- is the frontal area ()
- is the equilibrium velocity (measured terminal velocity)
- is the gravitational acceleration (on Earth, )
Based on measurements:
| r - radius | A - frontal area | v - terminal velocity | m - calculated mass | |
|---|---|---|---|---|
| small balloon | 0.05m | 0.00785m2 | 3.35 m/s | 2.57 g |
| large balloon | 0.1m | 0.01m2 | 1.72 m/s | 2.71 g |
However, there are more practical applications for speed measurement using image processing in real life. For instance, construction material inspection companies need to determine, during facade fire spread examinations, the velocity at which burning pieces falling from the facade descend, therefore determining how dangerous they are for firefighters or those nearby. I’m currently collaborating with Péter László Tóth on a research related to this, about which you can read more in the Protection Science Journal VII. issue.